
Development of a multivariable prognostic prediction model for skin tears in older nursing home residents

Participants and clusters
At baseline, 149 participants allocated to the control group were enrolled across 8 clusters. However, due to the COVID-19 pandemic, 2 clusters comprising 34 residents were not available for the 12-week follow-up. Additionally, 6 participants from the 6 remaining clusters could not be followed up for other reasons (e.g., death or being at the end of life). Consequently, follow-up data at week 12 were available for 109 residents across 6 clusters. Of these 109 residents, 8 participants presented with a skin tear at baseline, and were therefore excluded from this analysis. This left a final sample of 101 participants from 6 clusters for analysis. No additional clusters or participants were excluded due to missing data or other reasons beyond the established eligibility criteria. Figure 1 provides a detailed flow chart of the data selection process, illustrating which data were included in this analysis from the complete dataset of the underlying clinical trial.
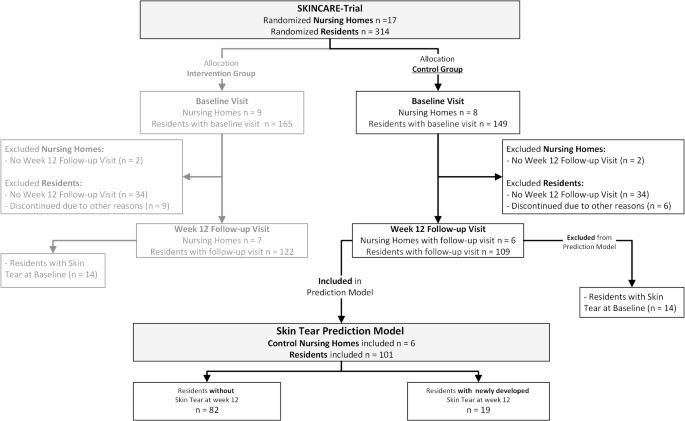
Flow chart data selection.
Sample characteristics
Table 1 provides an overview of the baseline characteristics of the analyzed sample, categorized by the presence or absence of a newly developed skin tear at week 12. The mean age of participants was 84.7 years (SD 7.2), and the majority were female (66.3%). The mean BMI was 26.9 kg/m2 (SD 5.4). At the week 12 follow-up visit, 19 out of 101 residents developed a skin tear, resulting in a cumulative incidence of 18.8%. The ICC for skin tears at week 12 was 0.172.
Risk of bias assessment and applicability
All PROBAST domains were judged to be at low risk of bias. The underlying RCT included a representative sample of nursing home residents aged 65 and older. The inclusion/exclusion criteria were appropriately defined. All predictors were uniformly defined and assessed across participants, and the predictor assessments were conducted without knowledge of the outcome data. Additionally, all predictors included in the model are readily available in clinical practice. The outcome (skin tears) was classified using the standardized ISTAP definition. None of the predictors used in the model were involved in determining the outcome. Assessors were blinded to predictor information, as the decision for prediction modeling was made after data collection. The 12-week follow-up period provided an appropriate time interval between predictor assessment and outcome determination. The PROBAST assessment, including detailed judgement of each domain, is available in Appendix 1.
Model development
Predictors
A total of 30 variables were included in the initial analysis (Table 1). In the group comparison, 6 baseline characteristics emerged as potential candidate predictors for the development of skin tears by week 12, based on significance. Participants who developed skin tears had a significantly lower BMI than those who did not (mean difference 4.84, 95% CI 2.60–7.23, p < 0.001). More specifically, being underweight (BMI < 18.5) was significantly associated with skin tears (OR 7.50, 95% CI 1.33–34.79, p = 0.016), while participants who were overweight (BMI ≥ 25) were less frequently found in the group that developed skin tears (OR 0.24, 95% CI 0.07–0.71, p = 0.006). Residents who developed skin tears had a shorter duration of residency in the nursing home (mean difference 12.52, 95% CI 2.55–21.71, p = 0.015), and those with lower Braden Scale scores were more likely to be at risk (mean difference 1.99, 95% CI 0.59–3.47, p = 0.008). Higher GDS scores (between 4 and 7) were more common in residents who developed skin tears (OR 3.20, 95% CI 1.00–10.30, p = 0.024).
The Barthel Index Total Score showed a substantial mean difference between groups (mean difference 10.48, 95% CI − 1.60 to 21.39, p = 0.078), and was therefore included in further analysis, as lower scores were associated with skin tears.
Additional variables were included based on their ORs (≤ 0.5 or ≥ 2). Higher frequencies of skin tears were associated with dementia (OR 2.26, 95% CI 0.79–7.23, p = 0.108), xerosis cutis on the arms (odds ratio 2.39, 95% CI 0.63–7.29, p = 0.260) and legs (OR 2.79, 95% CI 0.53–5.32, p = 0.322), hemiparesis (odds ratio 2.89, 95% CI 0.63–17.29, p = 0.159), paralytic symptoms (OR 2.22, 95% CI 0.83–13.30, p = 0.514), and smoking status (OR 2.00, 95% CI 0.63–8.53, p = 0.237). Conversely, lower frequencies of skin tears were observed among participants who were taking medications influencing the renin-angiotensin system (OR 0.49, 95% CI 0.17–1.37, p = 0.162), those with diabetes (OR 0.49, 95% CI 0.12–1.32, p = 0.175), and female participants (OR 0.49, 95% CI 0.16–1.48, p = 0.161).
Univariate logistic regression
Results of the univariate logistic regression analysis for each potential predictor are shown in Table 2, reflecting their individual effects on the outcome. Lower Braden Scale total scores at baseline were associated with increased odds of developing skin tears (OR 0.842, 95% CI 0.724–0.980, p = 0.026). Similarly, a decrease of one unit in BMI was linked to a 22% increase in the odds of skin tear development (OR = 0.780, 95% CI 0.675–0.901, p < 0.001). When BMI was categorized, underweight individuals had a significantly higher risk, with a 7.5-fold increase in the odds of developing skin tears (OR = 7.50, 95% CI 1.16–48.56, p = 0.035). Conversely, individuals categorized as overweight (BMI ≥ 25) had a 76% reduction in the odds (OR = 0.24, 95% CI 0.08–0.70, p = 0.009). Residents classified in GDS stages 4–7 were at a 3.2-fold higher risk of developing skin tears (OR 3.20, 95% CI 1.13–.07, p = 0.029).
For duration of residency, each additional month was associated with a 2% reduction in the odds of developing a skin tear (OR 0.978, 95% CI 0.954–1.003, p = 0.080). Individuals with fecal incontinence demonstrated over twice the odds of developing skin tears (OR 2.26, 95% CI 0.82–6.24, p = 0.115), and those with dementia had a 2.26-fold increased risk (OR 2.26, 95% CI 0.82–6.22, p = 0.113).
The Braden Mobility Score indicated a potential increase in risk, with reduced mobility linked to a 37% increase in the odds of skin tear development per unit decrease (OR = 0.627, 95% CI 0.321–1.223, p = 0.171). Smoking status also trended toward increased risk, with smokers showing a twofold increase in the odds of developing skin tears (OR = 2.00, 95% CI 0.63–6.41, p = 0.243), though this result was not significant.
Other variables, such as the use of medication influencing the renin-angiotensin system (OR 0.49, 95% CI 0.18–1.35, p = 0.167), xerosis cutis on the arms (OR 2.39, 95% CI 0.51–11.33, p = 0.272), and xerosis cutis on the legs (OR 2.80, 95% CI 0.34–23.04, p = 0.341), showed some association with skin tear risk, though none of these findings reached statistical significance. Detailed results are presented in Table 2.
To assess relationships between predictors and address potential collinearity, a correlation analysis was conducted. The correlation matrix is shown in Appendix 2. The Braden Scale total score was strongly correlated with its Mobility sub-score (r = 0.912), the Barthel Index total score (r = 0.840), and its sub-scores for Standing/Mobility (r = 0.848) and Transfer (r = 0.790). The Barthel Index also correlated with the Braden Mobility sub-score (r = 0.811). Fecal incontinence showed a positive correlation with GDS stages 4–7 (r = 0.671). To avoid collinearity, variables measuring the same construct, such as BMI and its categories (e.g., Underweight or Overweight), were not included together in the models. Instead, only one variable per construct was used to prevent redundancy and improve model stability.
Multivariable logistic regression
Initially, all selected predictors were included in the multivariable logistic regression model. Among highly correlated pairs, only one variable from each pair was retained. The Barthel Index was preferred over the Braden Scale and its sub-scores due to its stronger association with the outcome. Although the Barthel Index did not reach statistical significance (p = 0.114), it remained in the final model of the Backward Wald.
GDS 4 to 7 was retained in place of fecal incontinence, which was removed early in the backward selection process. Similarly, xerosis of the legs was kept instead of xerosis of the arms, as it showed greater consistency throughout the selection process. BMI was used as a continuous variable, as it consistently showed significance across all models, rather than its categorical forms (underweight/overweight). It consistently emerged as a significant predictor across all models (Backward Wald: p = 0.001; Forward Selection: p = 0.002; Bidirectional Stepwise: p = 0.002).
GEE analysis
To account for clustering at the nursing home level, candidate predictors were analyzed using GEE. The initial set of variables selected for GEE analysis, after considering collinearity, redundancy and relevance, included: age, BMI, duration of residency, Barthel Index at baseline, sex, smoker status, dementia, medication (angiotensin), corticosteroid use, GDS (stages 4–7), diabetes, hemiparesis, paralytic symptoms, IAD, pressure ulcers, intertrigo, and xerosis of the legs at baseline.
Multicollinearity was assessed using the Variance Inflation Factor (VIF). All variables demonstrated acceptable levels of multicollinearity, with VIF values below the common threshold of 5. BMI (VIF = 1.697) and GDS (stage 4–7) (VIF = 2.138) showed the highest values but remained within acceptable limits.
Through a stepwise backward elimination and forward selection process, predictors that did not meet the significance threshold (p > 0.05) were excluded. The final model included four significant predictors of skin tear development at week 12: BMI, use of corticosteroid medications, presence of xerosis on the legs, and Barthel Index score (Table 3).
Model performance
The ROC analysis of the final predictive model yielded an AUC of 0.823 (95% CI 0.703–0.943), indicating strong discrimination between residents who developed skin tears and those who did not (Fig. 2).
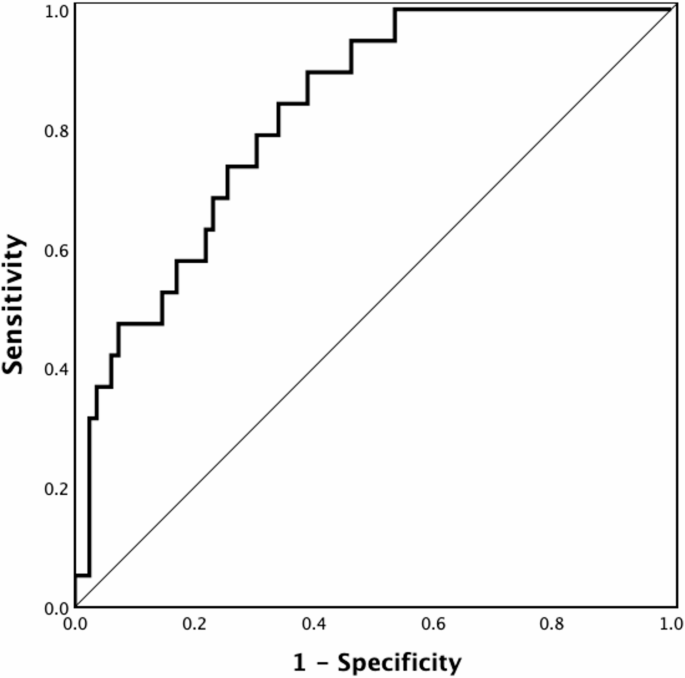
Receiver Operating Characteristic (ROC) curve of the final prediction model.
Sensitivity and specificity were calculated at different cutoff probabilities. Initially, a threshold probability of 0.7 was applied, resulting in a specificity of 98.8% but a sensitivity of only 5.3%. To address the imbalance between sensitivity and specificity at this initial cutoff, an exploration of alternative cutoff values (0.1, 0.3, 0.5) was conducted. Furthermore, a balanced cutoff value (≈ 0.175) was identified, achieving approximately equal sensitivity and specificity. This balanced cutoff yielded a sensitivity of 73.7% and a specificity of 74.4%. Table 4 summarizes the performance metrics across these cutoff values.
The calibration plot demonstrated good alignment between predicted probabilities and observed outcomes in the lower-risk groups (e.g., predicted probability of 0.09 vs. observed proportion of 4.00%) (Fig. 3). However, the model showed a tendency to overestimate the risk of skin tears in higher probability groups (e.g. predicted probability of 0.57 vs. observed proportion of 10.00%). The Hosmer–Lemeshow goodness-of-fit test was non-significant (χ2 = 3.80, df = 8, p = 0.875), indicating good overall calibration of the model. These findings suggest that, while the model provides accurate risk estimates for individuals with lower predicted probabilities, there is a tendency to overpredict risk in higher-risk categories.
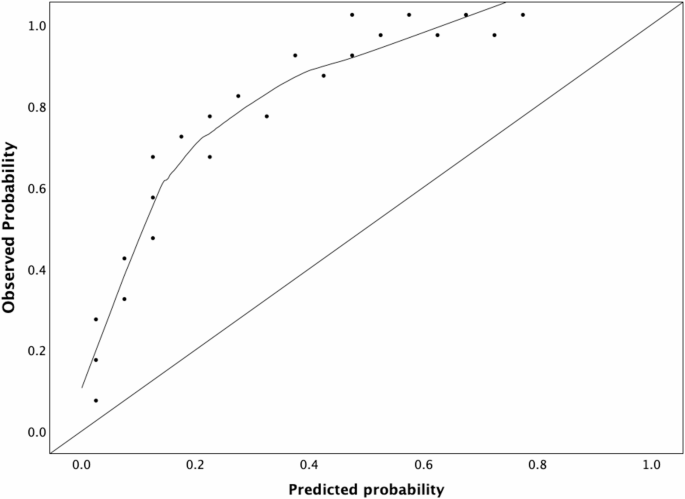
Calibration plot for the final prediction model.
link
")


