


Wireless, skin-integrated pressure monitoring system
The pressure monitoring system consists of three main components: (1) a skin-integrated pressure monitoring device, (2) a mobile device with a user interface for system control and communication, and (3) a satellite wirelessly connected unit that alerts patients or caregivers when pressure levels and time intervals exceed a predefined threshold. Figure 1A illustrates the areas most susceptible to pressure ulcers, particularly the sacrum and heel, where skin-integrated pressure monitoring devices with anatomically matched layouts can be positioned to alert caregivers to the potential for ulcer formation. These high-risk areas also include the head, back, elbows, and ankles, where related types of monitoring systems could be effectively used. The design conforms to the contours of each region, featuring multiple pressure sensors strategically placed in arrays across the most vulnerable locations.

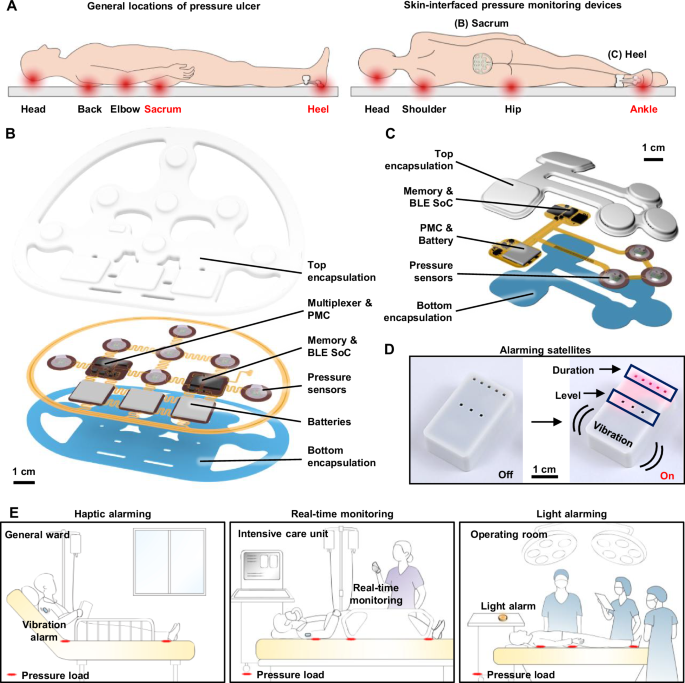
A Schematic illustrations of general locations of pressure ulcer generation and the skin-integrated pressure monitoring devices on the sacrum and heel. B, C Schematic illustrations of an exploded view of skin-integrated pressure monitoring devices for sacrum and heel. D A satellite unit provides alerts of the risk of pressure ulcers by vibration and light emission. E Use scenarios of a pressure monitoring and alerting system to prevent ulcer generation in various hospital settings.
Figure 1B, C shows schematic, exploded view illustrations of devices designed for the sacrum and heel, respectively. The pressure sensors rely on modifications to commercial system-on-chip (SoC) barometers (TE Connectivity, MS5611)17,18. Here, removal of the metal cap exposes the piezo-resistive strain gauge membrane to allow introduction of a liquid prepolymer to an elastomer. Curing forms a soft, solid structure that can transfer mechanical pressure imposed from the surroundings onto the membrane. Careful designs ensure that the range over which pressures can be measured accurately with such devices aligns with clinical requirements. Each sensor module created in this manner measures both pressure and temperature at its respective location. A BLE SoC (Insight SIP, ISP1807) manages the operation of the system using a multiplexer to control seven sensors and to wirelessly transfer data to a mobile device. A memory chip (Micron Technology Inc., MT29F2G01) records the pressure and temperature data, which are also wirelessly transmitted via the BLE SoC to a mobile device, enabling both onboard storage and real-time communications. Three small, rechargeable lithium polymer batteries (DNK Power, DNK201515, 20 mAh) supply power. A radio frequency coil and battery charging circuit (Texas Instruments, BQ25101) enable wireless recharging. During continuous operation with data transmission every 1 s, the device consumes ~150 μA, supporting over 2 weeks (~16 days) of monitoring. Extending the transmission interval to 30 s significantly reduces the average current consumption to ~21 μA, resulting in an operational lifetime of ~115 days. Further reductions in power consumption are achievable when the device operates using memory only, where the data are saved internally without wireless transmission. (Fig. S1). All components, including the pressure sensor, BLE SoC, memory, battery, and power management circuitry on the fabricated printed circuit board (FPCB), are mounted within an elastomeric enclosure formed by top and bottom layers of silicone (Silbione RTV 4420) to ensure safety in clinical environments. The internal cavity formed by the bonding of these layers is filled with an uncured polyorganosiloxane elastomer (Ecoflex 00-30), cured at room temperature for 24 h. Additional details on device fabrication are in the “Methods” section.
Figure 1D shows the satellite unit mentioned previously, which features a vibrating actuator and light-emitting diodes for haptic and visual alerts, respectively. These alerts activate at magnitudes and frequencies that correspond to user-defined levels of risk inferred from the time-dependent measurements of pressure. The system supports various hospital environments, including haptic alerts for patients in general wards, real-time monitoring in intensive care units, and visual alerts during surgeries (Fig. 1E). Caregivers or users can customize alert thresholds based on the conditions of the patient. This flexibility allows the device to alert for potential pressure ulcer formation across multiple care settings by providing continuous monitoring and timely feedback.
Soft pressure sensor for body pressure monitoring
Robust and reliable operation is essential, without drift or damage across repeated loading and unloading cycles, throughout long-term, high-load conditions, and during temperature fluctuations19,20,21. As mentioned previously, the sensors introduced here rely on custom modifications of commercial barometric pressure sensors (Fig. 2A). The specific design uses a truncated cone-shaped silicone elastomer molded above, as described in the “Methods” and Fig. S2. FEA simulations demonstrate that pressure applied through elastomer compression induces mechanical strains that correspondingly change the resistance of the piezoresistive microelectromechanical membrane structure, enabling accurate pressure sensing (Fig. 2B). These simulations validate mechanisms for the translation of mechanical deformations into electrical signals by resistance changes. Moreover, the uniform pressure distribution across the sensor membrane guarantees consistent and accurate readings, with pressure distributions between 8.7 and 11 kPa when applied at 10 kPa (Fig. 2C). To mitigate potential signal drift caused by fluctuations in body temperature, the SoC utilizes an integrated temperature sensor and temperature compensation algorithm to maintain stable and accurate pressure measurements. Recalibration after encapsulation involves revision of the constants in the compensation algorithm to reflect the effects of removal of the metal cap, application of a silicone elastomer layer, and complete encapsulation in the final device. In addition, a calibration process for each sensor in the array allows those with parameters that lie outside the target sensitivity range to be replaced, resulting in a final array with uniform performance. The supporting data in Fig. S3 present calibration curves of the seven sensors and confirm minimal inter-sensor variability, underscoring the reproducibility and robustness of the platform. Accurate and long-term pressure monitoring remains a persistent challenge for traditional thin-film pressure sensors due to their susceptibility to mechanical deformation and thermal drift. The engineered barometric sensor introduced here overcomes these limitations through robust structural design and integrated compensation features, as demonstrated in the following set of experimental results. The data in Fig. 2D show a linear correlation between the loading and unloading cycles, with no measurable hysteresis. The design of the elastomer structure allows for modulation of the sensitivity and sensing range of the sensor. In this study, an elastomer structure with a height of 2 mm, a 5 mm diameter at the top, and 10 mm at the base provides a sensing range of 0–40 kPa, which covers the range of body pressures of relevance here. Figure 2E shows the long-term stability of the pressure sensor, with constant pressure loads of 10, 20, and 50 g by weight, corresponding to pressure values of 1.54, 3.08, and 7.70 kPa, respectively. The results show a minimal drift rate, with an output that remains within ±2% of the initial value after 12 h of continuous monitoring. This stability is crucial for applications that require prolonged pressure monitoring, such as during sleep or in clinical environments where consistent pressure readings are necessary to prevent pressure ulcers. Regarding durability, Fig. 2F shows that the sensor exhibits minimal variation in its response after 5000 cycles of loading and unloading at a pressure of 5 kPa. The elastomer allows the sensor to recover its original shape and to resist permanent deformation, even after extended periods under load. As a result, the sensor maintains accurate and consistent pressure measurements over time without the need for recalibration. Regarding flexibility, the performance is unchanged for bending to a radius of down to 10 mm, which covers the typical human body curvatures (Fig. 2G). The results in Fig. 2H show the response to the shear forces with a 5% variation compared to normal stress conditions. This minimal change indicates that the sensor can maintain reliable performance even when exposed to complex loading conditions, including shear stress. The ability to resist performance degradation under shear forces is critical for ensuring accurate pressure monitoring in dynamic environments, such as during movement or repositioning. As shown in Fig. 2I, the sensor maintains consistent pressure readings across the temperature range of human skin (within 2% from 25 to 45 °C).

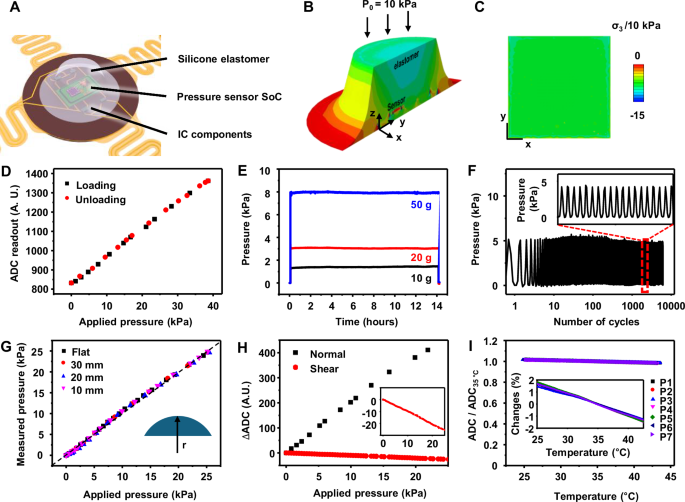
A Illustration of the design features of the soft elastomer-encapsulated pressure sensor, showing the internal components, including the pressure sensing element, encapsulating elastomer, and connection circuitry. B, C Finite element analysis (FEA) simulation of the stress distribution of the pressure sensor. B shows the stress distribution within the elastomer structure, and C provides a stress distribution of the surface of the sensor membrane under pressure. D Linear response of the sensor during loading and unloading cycles with minimal hysteresis. E Long-term stability of the pressure sensor under continuous loads of 10, 20 , and 50 g, corresponding to pressure values of 1.54, 3.08, and 7.70 kPa, respectively. F Pressure response of the sensor after approximately 5000 cycles of loading and unloading. G Sensor performance on curved substrates shows that the pressure response remains consistent when compared to measurements on flat substrates. H Shear stress stability of the sensor compared to the normal stress. I Temperature response of seven pressure sensors in the device.
Skin-integrated pressure monitoring system
Figure 3A shows a photograph of a sacral pressure monitoring device with labels of pressure sensor sites (P1–P7). The device is directly interfaced with the skin of a patient lying on a hospital bed. The device incorporates a soft cushion that protects the skin and reduces the risk of pressure injuries22,23, particularly in the sacral region, which is highly vulnerable to pressure accumulation. Additional FEA-based compressive analysis (Fig. S4A) characterizes the system performance with the integrated cushion. The results (Fig. S4B, C) quantify the uniformity of the force distribution of the complete device-cushion assembly. Bending and twisting tests confirm that the device adheres to the cushion without introducing high strain (Fig. S4D–I). The inset image highlights the strategic placement of seven sensors (P1–P7) across key anatomical locations: P1 (Upper left), P2 (Upper center), P3 (Upper right), P4 (Middle left), P5 (Middle center), P6 (Middle right), and P7 (Bottom). Each sensor targets a region prone to pressure buildup, enabling real-time assessment of pressure injury risk.

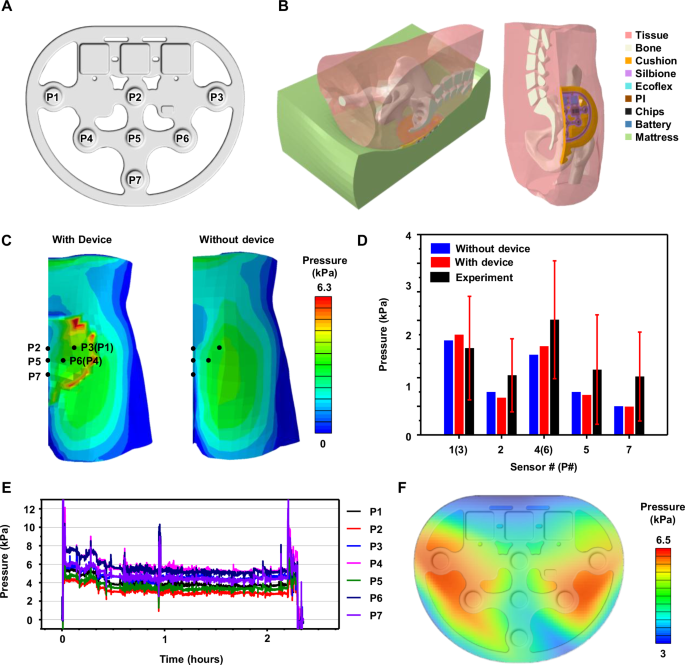
A Photograph of a sacral pressure monitoring device with labels of pressure sensor sites (P1–P7). B FEA simulation models for pressure distributions at the skin interface for a subject lying on a bed. C Pressure distribution at the sacrum with and without the device. D Comparison of pressure at each sensor location with and without the device. E Representative pressure profiles of a patient lying on a bed in the operating room. F Areal mapping of the average pressure measurement from (E). The cushion is made of soft polymer foam, and its elastic modulus is given in Table S3.
Figure 3B presents an FEA model to evaluate the mechanical interaction between the pressure monitoring device and the skin. The simulation includes layers representing human tissue, bone, the soft cushion, the mattress, and the structural components of the device, including silbione, ecoflex, polyimide, components, and batteries. The FEA resultss and experimental measurements, as shown in Fig. 3C, D, involve realistic loading conditions, with the subject lying supine on a standard hospital mattress. Figure 3C, D show that pressure loads at the sensor sites (P1–P7) remain largely consistent, comparable to those measured without the device. The device architecture features a punctured, stretchable design that enhances breathability and minimizes localized stress. The localized increase observed in Fig. 3C originates primarily from the adhesive layer of the cushion pad rather than the device itself. For example, pressure at P1 and P3 are 3.3 kPa without the device and 3.5 kPa with it; P2 shows 1.5 and 1.3 kPa, respectively; P4 and P6 increase slightly from 2.8 to 3.1 kPa; P5 shows a minor decrease from 1.5 to 1.4 kPa; and P7 remains nearly unchanged (1.0 vs. 0.99 kPa). Notably, sensors P1 and P4 display relatively higher pressure values, consistent with their load-bearing anatomical locations. Simulation values align well with experimental data (averaged values from 7 clinical trials, Tables S1 and S2), with deviations at P1 (+17%), P4 (−23%), P2 (−38%), P5 (−39%), and P7 (−51%), all within acceptable experimental variance (±σ). The cushion does not require customization for individual anatomys, as the pressure change induced by its presence is minimal (Fig. 3D).
Other versions of this device architecture enable localized pressure monitoring in anatomically complex regions, such as the heel (Fig. S5A, B). Replacing Silbione (modulus E: 800 kPa) with Ecoflex (modulus E: 60 kPa) for the encapsulation layer softens the device, resulting in a 3% decrease in maximum skin pressure from 7.3 to 7.1 kPa (Fig. S5C). Adjusting the cushion geometry to align the outer surface of the device with the cushion plane eliminates protrusions and further reduces peak pressure by 4% (from 7.1 to 6.8 kPa). In addition, by selectively adjusting the modulus of the cushion, particularly in the regions that directly interface with the device (Fig. S5D) to closely match that of human tissue (Fig. S5E), the system achieves a minimum pressure of 5.4 kPa, representing a 21% reduction (Fig. S5F). The modulus of the cushion depends on the relative density (or porosity) of the foam24,25,26,27,28, commonly controlled via variation of the chemical blowing agent content during foam fabrication29 to attain mechanical properties approximating those of human soft tissue.
The final optimized configuration combines materials and geometric refinements to achieve a 28–40% pressure reduction compared to the initial design. As shown in Fig. S5G, pressure readings at sensor sites in the optimized configuration closely matched those of the cushion alone, differing by only 1–5%. These modular and adaptive design strategies offer broad applicability across anatomical sites beyond the heel for patient-specific pressure monitoring needs.
Figure 3E displays real-time pressure monitoring profiles collected in a hospital environment. The data correspond to continuous recordings for over two hours across all sensor locations (P1–P7), with the patient in a supine state. Dynamic pressure variations reflect subtle postural shifts, small movements, and redistribution of body weight30. At approximately 1 h, transient fluctuations appear due to larger body movements, as confirmed in the expanded profile (54–59 min) in Fig. S6. Higher values occur at P1, P3, P4, and P6, corresponding to regions near the buttocks that bear most body weight. In contrast, P2, P5, and P7 display relatively lower pressures, indicating areas with less direct load or those supported by the structural design of the cushion. This continuous monitoring capability provides critical data for identifying time-dependent pressure changes and detecting potential high-risk zones for pressure ulcer development, enabling timely clinical intervention. Figure 3F represents a visualized average pressure distribution derived from the time-series data in Fig. 3E. The pressure map uses a gradient color scale, where red indicates areas of higher pressure and blue represents lower pressure. The results demonstrate that soft tissue regions, such as the buttocks, experience concentrated pressure, consistent with the weight-bearing nature of these areas. In contrast, regions over bony prominences or areas with thin soft tissue exhibit reduced pressure values. This mapping provides an intuitive spatial overview of the pressure distribution, facilitating the identification of high-risk regions prone to pressure ulcers. The observed trends align well with the simulation results, reinforcing the ability of the device to accurately capture pressure profiles in clinical settings.
Continuous pressure monitoring and alarming feedback system
Figure 4 focuses on the continuous pressure monitoring system and its alarm feedback mechanism. Posture changes, such as from supine to left or right lying positions, lead to redistributions of pressure. Continuous monitoring at multiple locations provides valuable data for evaluating health risks and detecting areas vulnerable to pressure injuries. Figure 4A illustrates posture changes between supine, left-side, and right-side lying positions. The system integrates multi-channel pressure monitoring devices to cover the sacrum (Fig. 4B) and both heels (Fig. 4C, D). The sacrum device incorporates seven sensors (P1–P7), while each heel device features three sensor channels (Interior, center, and exterior). These devices are independently capable of detecting pressure levels, posture, and weight distribution, ensuring precise and localized monitoring of pressure dynamics. Figure 4G–I presents the continuous recordings of pressure values collected at each sensor location, sampled at a rate of 1 Hz. The data reveal distinct patterns of pressure distribution depending on posture change. When lying supine, the pressure distributes evenly across the sacrum and heels. In the left or right side-lying positions, however, the pressure becomes asymmetrically distributed, concentrating on the side in contact with the bed. The sacrum and heel sensors capture this biased distribution to provide quantitative insights into how posture affects pressure levels in different regions (Fig. S7).

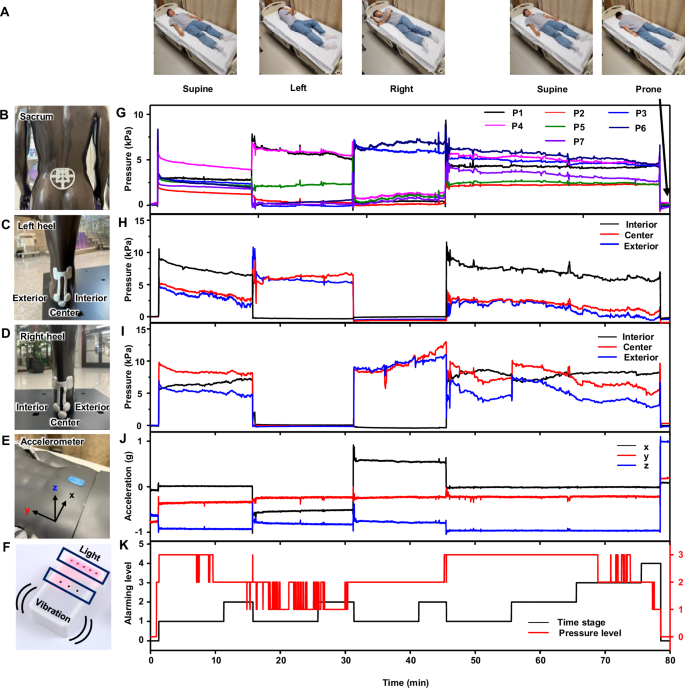
A Photographs of a subject in different postures. B–D Photographs of the devices at each location and G–I the continuous monitoring of B sacrum, C left heel, and D right heel pressure. E Photographs of an accelerometer attached to the lower stomach, and J the acceleration data associated with posture changes of the subject. F Photograph of a satellite unit designed to alert the average pressure level and the time duration without posture changes, as well as K alarm level (Time stage, and Pressure level) associated with the pressure monitoring.
Figure 4J presents data obtained from an accelerometer shown in Fig. 4E, strategically placed on the lower abdomen. This device monitors postural changes in real-time by capturing accelerations along the x, y, and z axes relative to the gravitational vector. The results provide a comprehensive analysis of both pressure dynamics and postural shifts, with associated alerts that pass through the satellite unit (Fig. 4F). As shown in Fig. 4K, increasing exposure to pressure causes heightened light and vibration alert levels, thereby prompting individuals, on their own or with the assistance of healthcare providers, to adjust their posture to reduce the risk of pressure injuries. This demonstration involves two alarm logics: (i) a pressure-based alert, increasing by one step for every 2 kPa rise in averaged pressure, and (ii) a time-based alert, increasing by one step for every 10 min without posture change. These values serve as illustrative examples, rather than standardized clinical thresholds, and can be adjusted according to patient-specific or guideline-based needs.
Pressure monitoring in various scenarios
Practical demonstrations systematically monitor pressure across diverse environments. The soft and wireless configurations of these devices enable subjects to wear them comfortably in settings from an operating room to a bed at home during sleep. Figure 5A illustrates pressure monitoring in this latter case, for a healthy adult volunteer. The system captures time-series pressure data, correlating with sleep stages identified through a smartwatch. During deep sleep, the pressure data displays stable and consistent patterns of minimal movement. Conversely, during REM sleep, the pressure signals exhibit significant fluctuations, reflecting frequent changes in posture31,32. Figure 5B presents pressure data from a patient undergoing surgery, showing distinct pressure dynamics during different procedure phases, including scrubbing, operating, and microsurgery. The time-series data delineate distinct characteristics for each phase, reflecting pressure dynamics and patient positioning during extended procedures. Unlike conventional mattress-based pressure monitoring systems that require placement on the surgical bed—an approach often limited by sterility, restricted space, and workflow constraints—the wearable platform introduced here eliminates the need for bulky external installations and operates autonomously via BLE. The technology is thus practical for continuous monitoring during surgery as well as in daily settings such as home beds or chairs. Such data are essential for identifying high-risk areas where prolonged pressure could result in tissue damage2,3. In both scenarios, retrospective analysis of historical pressure profiles supports investigation into the relationship between ulcer development and sustained localized pressure, thereby advancing evidence-based prevention strategies. These capabilities highlight the contribution of the system beyond immediate repositioning, delivering both real-time alerts and actionable longitudinal data critical for reducing pressure-related tissue injury in environments where patient movement is restricted.

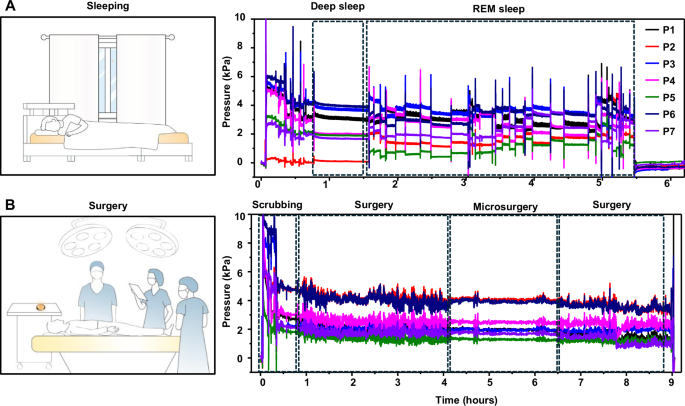
A Pressure monitoring during sleep. B Pressure monitoring during plastic surgery.
link